
Return on Cost: Lender Checklist and a 7.0% Worked Example

Return on cost (ROC), also called yield on cost, is stabilized net operating income divided by total project cost. It’s a cost-led yield that developers use to screen feasibility before committing capital. ROC tells you whether a deal clears the bar on paper, but it’s a single-point snapshot. Pair it with development spread analysis, DCF, and IRR modeling before you size a capital stack around it.
TL;DR:
- A positive development spread of at least 150 basis points between ROC and exit cap rate is typically required to justify construction risks, with spreads over 250 basis points indicating strong value creation.
- Full project costs must include land, hard and soft costs, financing, reserves, and contingencies; omitting any of these inflates the ROC and risks misrepresentation.
- Cost overruns, slow lease-up, rent declines, and rising interest rates are the primary risks that can reduce or eliminate the projected return on cost.
- Lenders pair ROC with discounted cash flow and IRR models, emphasize profit on cost, and verify assumptions with independent cost consultants before approving financing.
- Scrutinize high ROC figures based on optimistic rent growth or thin contingency lines, as stress testing ensures deal resilience under less favorable circumstances.
Table of Contents
- What Is the Return on Cost Formula?
- How Does ROC Compare to Cap Rate and Development Spread?
- What Counts as Total Project Cost?
- What Are the Biggest Risks to Return on Cost?
- How Do Lenders Use ROC in Underwriting?
- What Does Applied Return on Cost Look Like on a Real Deal?
- When Should You Second-Guess a Strong ROC Number?
- How Brookmont Capital Ventures Helps Validate Your Numbers
- Sources
- FAQ
What Is the Return on Cost Formula?
The return on cost formula is simple to state and harder to get right in practice:
ROC = Stabilized NOI ÷ Total Project Cost
Stabilized NOI is the net operating income the asset will generate once it’s leased up, operating at market occupancy, and no longer absorbing construction-period noise. Total project cost is every dollar it takes to get there, not just the sticker price on the construction contract.
Here’s how a developer actually builds the number:
- Underwrite market rents for the property type and submarket, using comparable leases signed in the last six to twelve months, not asking rents.
- Apply a realistic vacancy factor. A 5% to 8% vacancy allowance is typical for stabilized multifamily; retail and office often run higher depending on rollover risk.
- Deduct operating expenses, including property taxes at the post-improvement assessed value, insurance, management fees, and reserves.
- Sum total project cost, covering acquisition, hard costs, soft costs, financing carry, and contingency (detailed below).
- Divide stabilized NOI by total project cost and express the result as a percentage.
A worked example: a developer acquires a site for $2 million, spends $8 million on hard and soft costs, and carries $1 million in financing and contingency. Total project cost equals $11 million. Stabilized NOI comes in at $770,000. That’s a 7.0% return on cost. Most practitioners round to one decimal place and present ROC alongside the exit cap rate assumption in the same breath, since the number means little in isolation.
How Does ROC Compare to Cap Rate and Development Spread?
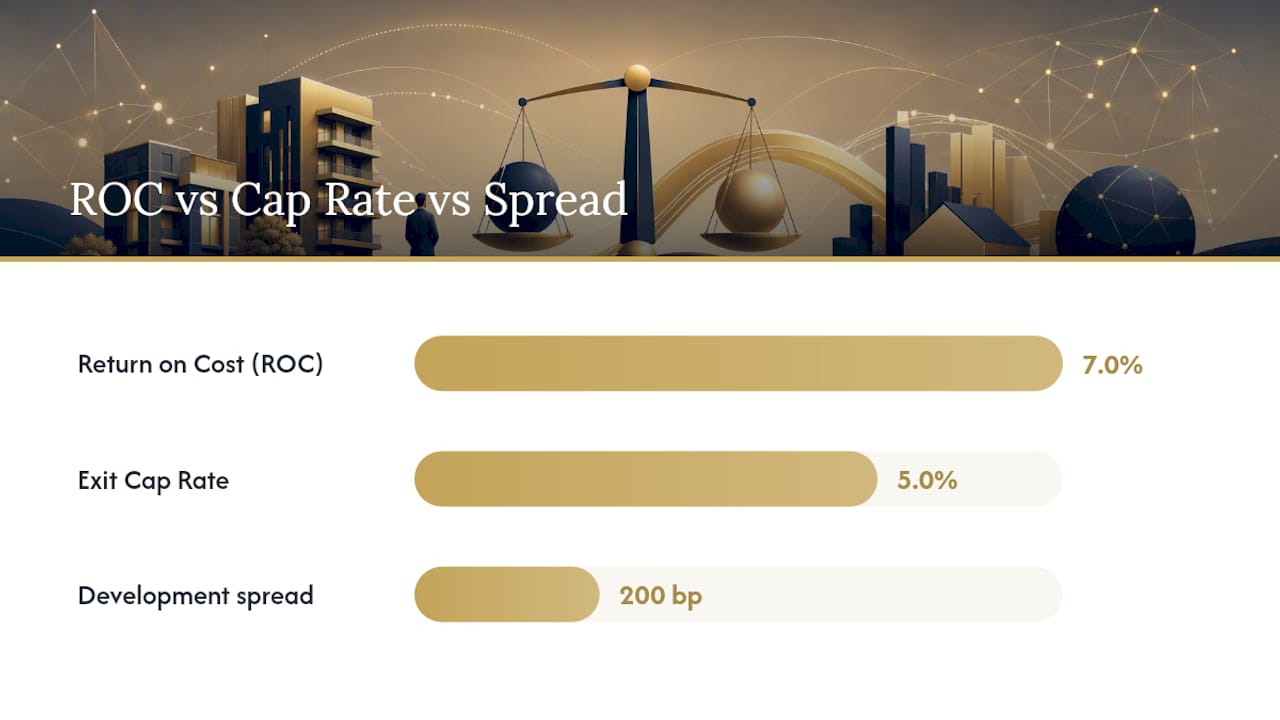
Cap rate is NOI divided by value or purchase price. ROC is NOI divided by cost. That denominator swap is the entire point of the metric: it tests whether building or repositioning an asset creates value versus simply buying one that already exists.
The gap between the two is the development spread, calculated as ROC minus the expected exit cap rate. A positive spread means the finished asset should be worth more than it cost to build.
- Spread under 100 basis points: thin margin, vulnerable to any cost or leasing slippage.
- Spread of 150 to 250 basis points: the range most developers target to justify construction and lease-up risk.
- Spread above 250 basis points: strong value creation, though it may signal an overly conservative exit cap rate assumption worth double-checking.
On the earlier example, a 7.0% ROC against a 5.0% exit cap rate produces a 200 basis point spread. At a $770,000 stabilized NOI capped at 5.0%, the finished asset is worth $15.4 million against an $11 million cost basis. That’s the value creation ROC is designed to surface.
What Counts as Total Project Cost?
Understating total project cost is the single easiest way to flatter a return on cost calculation, intentionally or not. A complete accounting includes:
- Land or acquisition cost, plus closing costs and transfer taxes
- Hard costs: construction, site work, and a general contractor’s fee
- Soft costs: architecture, engineering, permitting, legal, and insurance
- Financing costs and interest carry during construction
- Carrying costs during lease-up, including taxes and vacant-unit utilities
- Sales or refinance exit fees
- Operating reserves and a contingency line, typically 5% to 10% of hard costs
Sponsors frequently omit interest carry beyond the initial draw schedule, or they underprice contingency on projects with long entitlement timelines. Both mistakes inflate ROC and set up an unpleasant conversation with a lender later. For unit-rate benchmarks, cross-check your hard cost assumptions against independent cost consultant reports rather than relying solely on a single GC bid.
Pro Tip: Build your contingency line as a percentage of hard costs only, not total project cost. Blending it into soft costs and financing quietly understates the buffer you actually have against overruns.
What Are the Biggest Risks to Return on Cost?
ROC is a point estimate built on assumptions that can move fast. The highest-impact risks, in order of how often they actually derail deals:
- Cost overruns. Material and labor inflation can add 5% to 15% to hard costs mid-construction, especially on projects without a guaranteed maximum price contract.
- Slow lease-up. Every extra month of vacancy beyond your pro forma absorption schedule adds carrying cost and pushes stabilized NOI further out.
- Rent declines. A softening submarket between underwriting and delivery can shrink the NOI numerator directly.
- Interest rate shocks. Rising rates during construction increase carry costs and can push the eventual exit cap rate higher, compressing the development spread from both sides at once.
Stress-testing means flexing one variable at a time. A deal that only works under baseline assumptions isn’t underwritten, it’s hoped for. Mitigation tools include phased delivery to limit exposure, pre-leasing anchor tenants before breaking ground, and building contingency and rent assumptions on the conservative side rather than the market’s current peak. Reviewing common construction financing mistakes before you finalize a budget catches several of these issues early.
How Do Lenders Use ROC in Underwriting?
ROC is a stabilized snapshot. It tells you the destination but says nothing about the path, which is why lenders and sophisticated sponsors always pair it with a discounted cash flow model and IRR analysis that account for timing, lease-up drag, and exit-year assumptions.
A practical workflow looks like this:
- Use ROC as a first-pass feasibility screen and a sanity check on your assumed exit cap rate.
- Build a full DCF model that captures the unstabilized period, sensitizing rent growth, absorption speed, and financing costs year by year.
- Run IRR across a range of hold periods and exit scenarios rather than a single base case.
Lenders layer their own checkpoints on top of your ROC number. They’ll ask for profit on cost, which measures margin resilience before leverage enters the picture and is often the first figure an underwriter checks. They’ll cap loan-to-cost at a threshold tied to your sponsor experience and asset type. They’ll require an independent cost consultant to verify hard cost assumptions, and they’ll want contingency sized appropriately for the project’s entitlement and construction risk. Understanding how lenders underwrite mixed-use projects gives a useful preview of how granular these checks get before a term sheet gets issued.
What Does Applied Return on Cost Look Like on a Real Deal?
Some capital advisory firms structure and source financing across bridge loans, construction debt, DSCR loans, CMBS, and preferred equity for sponsors nationwide, which means ROC discipline shows up in every deal package they help assemble.
On a recent hotel repositioning engagement, the sponsor’s initial cost accounting excluded PIP-driven furniture and fixture upgrades from total project cost, understating ROC by a meaningful margin until the omission was caught and corrected before it reached the lender.
A tighter advisory checklist before you approach institutional capital includes:
- Third-party market study supporting stabilized rent and occupancy assumptions
- Independent cost consultant report validating hard cost line items
- Twelve-month trailing operating statement for value-add or repositioning deals
- Sensitized pro forma showing ROC and spread under at least three stress scenarios
When Should You Second-Guess a Strong ROC Number?
A headline return on cost that clears your target spread still deserves scrutiny. If the number depends on rent growth assumptions above recent trailing comps, or on a contingency line thinner than 5% of hard costs, treat it as a hypothesis, not a conclusion. Advisors earn their fee by asking sponsors to add cushion, extend lease-up timelines, or walk away from deals that only work under best-case math. Resilience under stress beats a headline number every time a lender starts asking questions.
— Jerry
How Brookmont Capital Ventures Helps Validate Your Numbers
Getting ROC and development spread right on paper is one thing. Getting a lender to agree with your numbers under current underwriting standards is another problem entirely, and it’s the one Brookmont Capital Ventures exists to solve. We work through capital stack advisory, source construction and bridge financing, and match sponsors with institutional lenders, banks, debt funds, and equity partners who actually close on the terms you modeled.
If you’re preparing to take a development or value-add deal to market, bring your stabilized pro forma, cost consultant report, and sensitized ROC scenarios to the conversation. We’ll pressure-test the numbers against what lenders are actually requiring right now and help you package the deal accordingly. Start by reviewing our financing solutions or explore bridge loan options if you need capital to carry the project through stabilization.
Sources
For deeper verification of the formulas and benchmarks referenced above, see the ROC calculator and formula breakdown, the cap rate versus return on cost comparison, and the development spread analysis.
- Return on Cost (ROC) | Formula + Calculator
- How to Value Real Estate: Cap Rate vs. Return on Cost
- What Is Return on Cost in Real Estate Development? | RE-Modeler Blog
- Profit on cost in property development finance
- Everything Real Estate Developers Need to Know About Return on Cost
FAQ
What Is a Good ROC for a 10-Year Hold?
There’s no universal figure since it depends on asset type and market, but most developers target a development spread of 150 to 250 basis points over the expected exit cap rate to justify the risk over a long hold.
Why Do Lenders Prefer IRR Over Simple ROI?
IRR accounts for the timing of cash flows, while a simple ROI or ROC figure only captures a stabilized snapshot. Advisors generally recommend combining ROC with DCF and IRR analysis so timing, exit assumptions, and lease-up risk all factor into the decision.
What Is the Formula for Return on Cost?
Return on cost equals stabilized net operating income divided by total project cost, expressed as a percentage.
Is a 4.5% Return on Cost Good?
Compare it against current market cap rates for your asset type before deciding whether the spread justifies construction and lease-up risk.
How Often Should You Update Your ROC Calculation?
Recalculate ROC at every major milestone, including at permit issuance, at any change order, and again at lease-up, since cost overruns and rent shifts both move the number directly. Reviewing development financing milestones helps map these checkpoints to your loan draw schedule.